

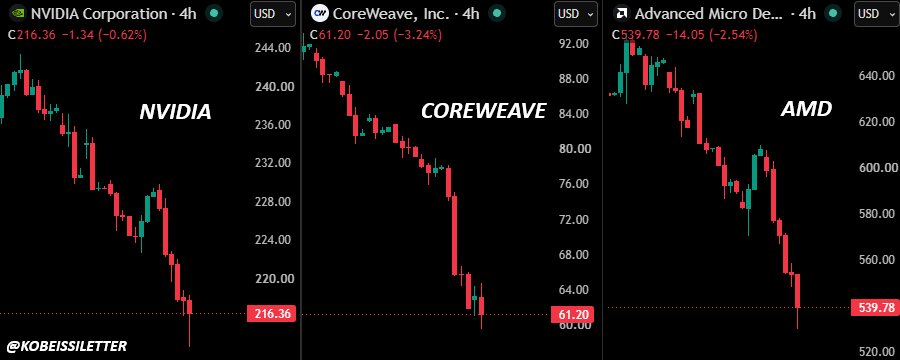
We receive thousands of questions per week. But recently, one has been the most common of them all. Oil prices are above $100/barrel, borrowing costs are at 2002 levels, and inflation is nearly double the Fed's 2% target. So, HOW is the S&P 500 trading ~2% away from a record high?
What if we told you that the S&P 500 can trade near record highs, while simultaneously being in a bear market?
That is exactly what we believe is happening. And we believe it represents one of the most significant opportunities in today's market.
We are now witnessing a historic market paradox: The "Bull-Bear" Market.
Below, we explain exactly what we mean.
The Iran War - Day #229
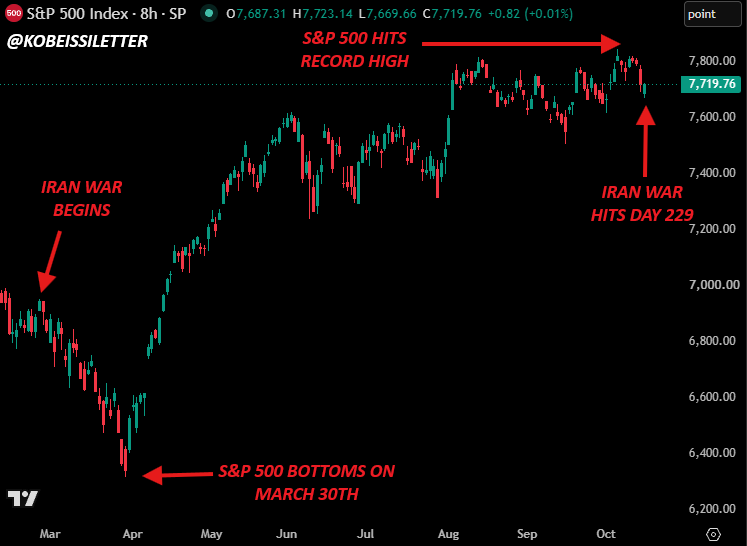
Today marks the 229th day of the Iran War. Since the start of the Iran War, the S&P 500 is up +900 points. And, since the March 30th bottom, the S&P 500 is up nearly +1,500 points, adding +$14 trillion of market cap.
The world is also a vastly different place than it was 229 days ago. Inflation has nearly doubled, the Fed is hiking interest rates, and we are in the midst of the biggest energy crisis in world history. And, we are also in the midst of the biggest technological revolution in world history.
Yet, if you ask most investors, the current sentiment is that the current fundamental backdrop has deteriorated compared to where it was 8 months ago.
The Macroeconomy - A Historic Shift In Expectations
At the start of 2026, the Fed was expected to CUT rates at least 3 times, for a total of 75 basis points this year.
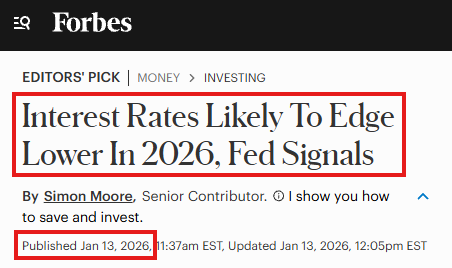
This was a major component of the bullish thesis for equities, with investors expecting cheaper capital, more investment, and record CapEx by technology companies.
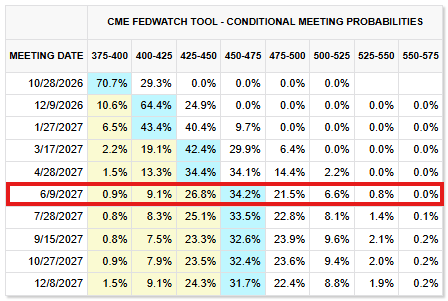
Today, the Fed has already hiked interest rates once this year and markets see another 3 interest rate hikes by June 2027, for a total of +100 basis points including September's rate hike. That's a +175 bps swing in rate expectations. Yet, the S&P 500 is still trading at record highs.
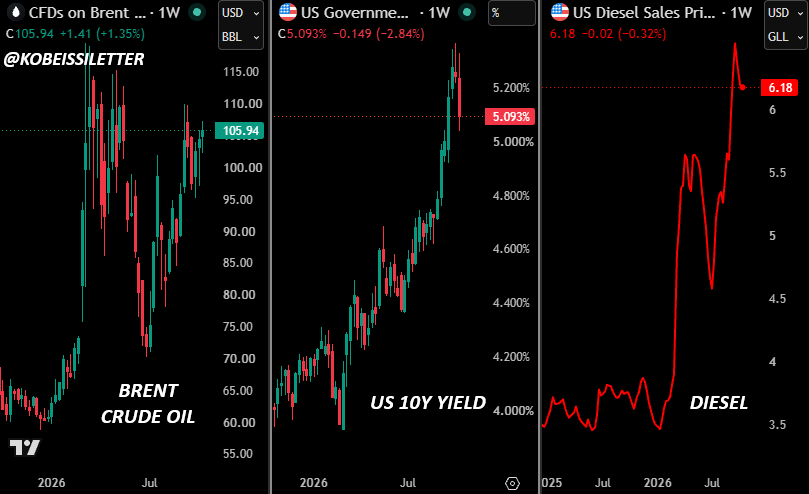
Driving this shift has been the historic surge in oil prices, with diesel now up over +80% from its low seen in January 2026 and Brent crude oil trading at $106/barrel.
Borrowing costs have surged as inflation doubled, the Fed is hiking rates, and the US is running a near-$2 trillion deficit. But still, the S&P 500 is at record highs.
So, what is happening?
Most Of The S&P 500 Is Struggling:
The reality is that the vast majority of the S&P 500's constituents are not trading anywhere near record high territory. Take a look at our analysis below.
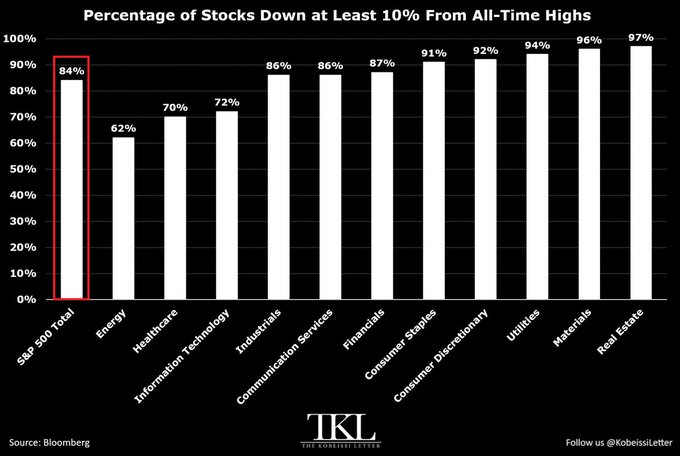
As indicated in the chart above, 84% of S&P 500 stocks are now trading at least -10% below their all-time highs.
Real Estate leads the drawdown, with 97% of stocks down at least -10%, followed by Materials at 96%, Utilities at 94%, and Consumer Discretionary at 92%.
Furthermore, 59% of S&P 500 stocks are down at least -20% from their highs, 41% are down more than -30%, and 17% are down more than -50%.
Now, take a look at return contribution since the March 30th bottom:
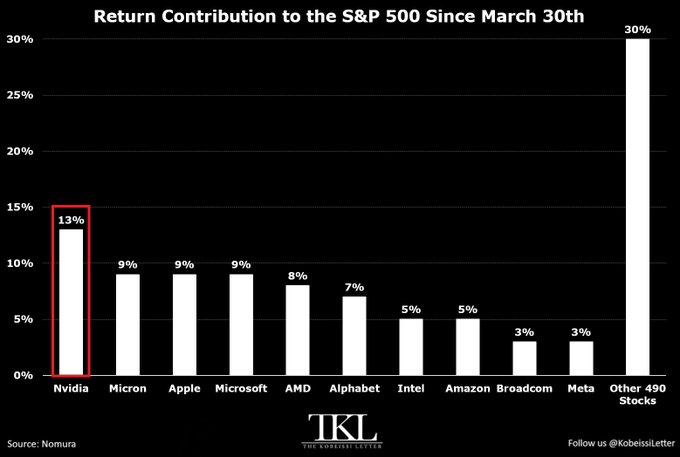
Just 10 stocks have driven 70% of the S&P 500’s gain since March 30th. These stocks have added +16 percentage points to the index’s +23% gain over this period. Nvidia, $NVDA, has contributed the most, accounting for 13% of the S&P 500's gain, or +3 percentage points.
This is followed by Micron, $MU, Apple, $AAPL, and Microsoft, $MSFT, each accounting for 9% of the S&P 500’s advance, adding +2 percentage points. Return contributions by AMD, $AMD, and Alphabet, $GOOGL, have been 8% and 7%, respectively.
Meanwhile, the remaining 490 stocks have accounted for just 30% of the S&P 500's gain since March 30th, adding +7 percentage points.
The reality is that the MAJORITY of S&P 500 components are, in fact, in a bear market. In our view, for the S&P 500, this is in fact bullish, or at worst, does not matter for now.
We explain why, next.
The S&P 500 Should Be Above 9,000:
Without the Iran War, the S&P 500 could be at 9,000+.
This is arguably the most resilient market in history. If the S&P 500 is 2% away from a record high despite inflation nearing 4%, gas prices on the rise, and the Fed HIKING rates, just imagine where the S&P 500 would be if the Iran War ended, oil prices came back down, and rate cuts returned. Or, if it never even happened.
Earnings growth just over the last 7 months of the Iran War has been historic, with the S&P 500 posting +52% blended earnings growth in Q2 2026.
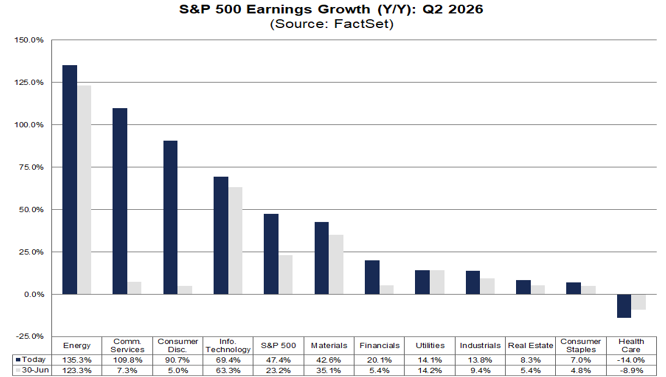
This marks the highest growth rate since Q2 2021, a period where the global economy was emerging from a historic lockdown and the US government handed out $4 trillion in stimulus.
In other words, in the midst of a global energy crisis and a rate hike campaign, we are now seeing growth on par with $4+ trillion in stimulus and a global economy that restarted from an effective halt.
The reality is that the AI narrative is even stronger than most people realize: the earnings growth is there to support it, even as inflation has been above 2% for 67 consecutive months.
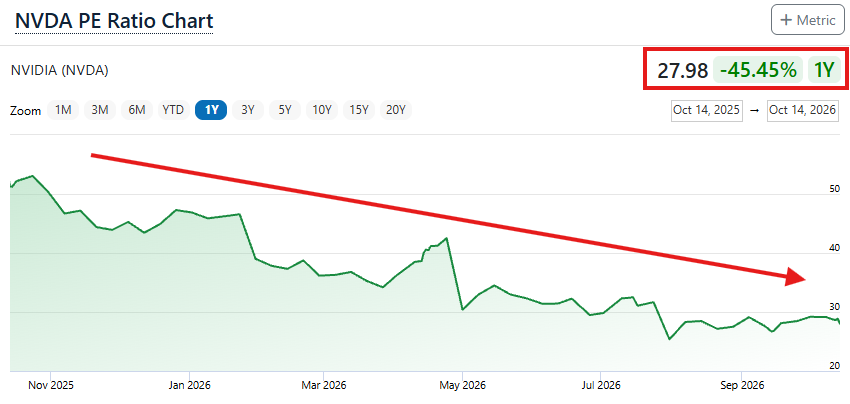
Take a look at Nvidia's P/E ratio over the last 12 months. Even as the stock is up +21% over this period, the company's P/E ratio is down -46%. The stock now has a Forward P/E ratio of ~24x, nearly in line with the S&P 500's 22x, even as $NVDA has risen +900% in 5 years.
This is the story for MANY large-cap technology stocks, the very names that are carrying this market.
As shown below, the S&P 500 and the S&P 500 Information Technology sector are now seeing nearly identical Forward P/E ratios. Historically, these stocks have almost always traded at a premium to the broader S&P 500.
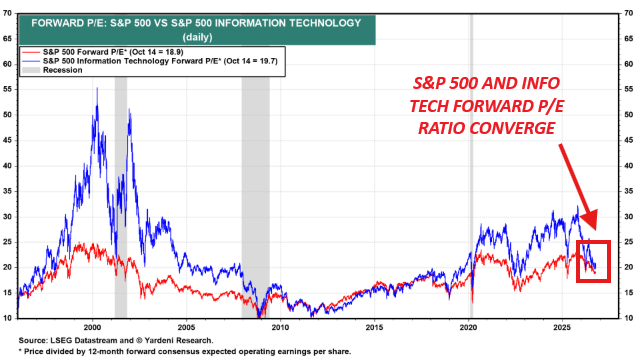
In our view, the very names that have been driving the equity market higher, most large-cap technology stocks, actually have deep discounts priced-in to their stocks, even as they trade at or near record highs. We believe these stocks would be trading MUCH higher if it were not for the macroeconomic factors that we have seen over the last seven months.
Combine this with the fact that over 80% of S&P 500 stocks are down -10% or more from their record highs, and our thesis is even stronger. If market breadth were to widen even slightly, buying pressure increases rapidly.
And, even without this shift, the large-cap technology stocks that are driving the majority of price action appear relatively "cheap" compared to the S&P 500.
This is why we said for the S&P 500, market concentration is bullish, or at worst, does not matter *for now.*
March 30th Was A Gift To Investors:
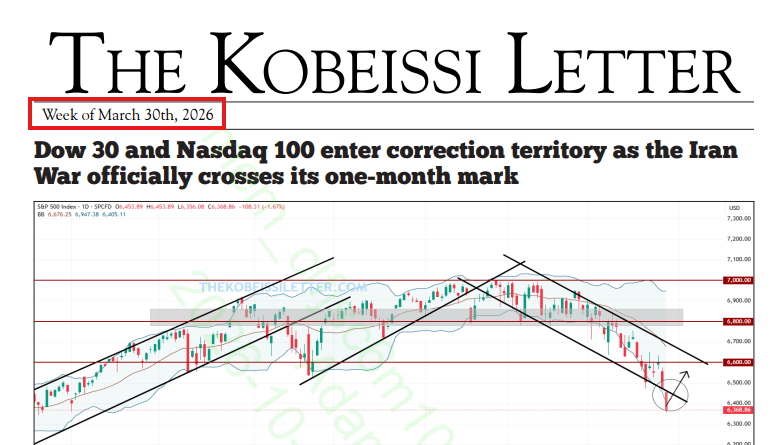
The thesis we outline today has been a central part of our investment strategy in our premium research since March 30th. Below is the front page of The Kobeissi Letter as published on March 30th, 2026.
As the S&P 500 fell below 6,400, we initiated a strong buy signal on the index and the equity market more broadly. Below is our note on the S&P 500 from March 30th.
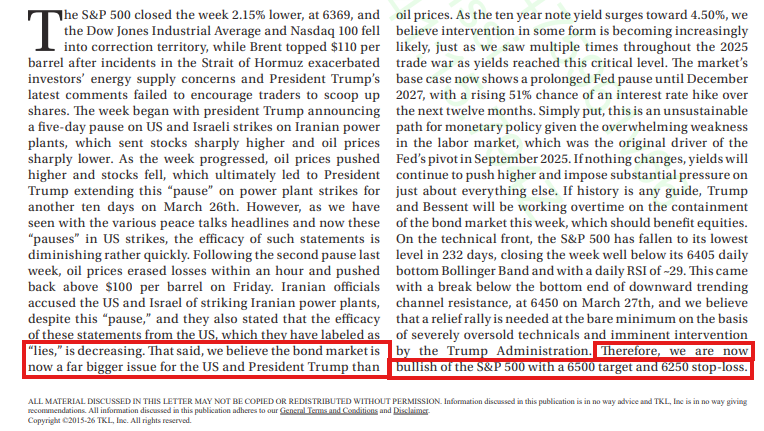
We noted that the bond market was a central part of our thesis along with the fact that the technology stocks that were driving the broader equity market lower were being sold with seemingly irrational price action.
The result was a "V-Shaped" recovery in the S&P 500, after which we continuously raised our S&P 500 target to 7,800, and we also called for bond market intervention by the Trump Administration.
Every Sunday, we update the above analysis in our weekly research and we also provide daily updates on our private X feed. If you are not already a client, consider subscribing to receive analysis like this in real-time here.
Today, the Trump Administration is intervening in the bond market, so far unsuccessfully, but further attempts at intervention are inevitable in our view.
Ultimately, however, our thesis today is rooted in our view expressed on March 30th, which has only gained more momentum as we look ahead to 2027.
Investors Want More Assets:
On top of the discount that is already priced-in to equity markets as discussed above, investors are keen to own assets amid the persistent inflation we are seeing in the US.
US CPI inflation has now been above the Fed's 2% target for 67 consecutive months. The last time inflation was below 2% in the US was in January 2021, amid a global economic lockdown.
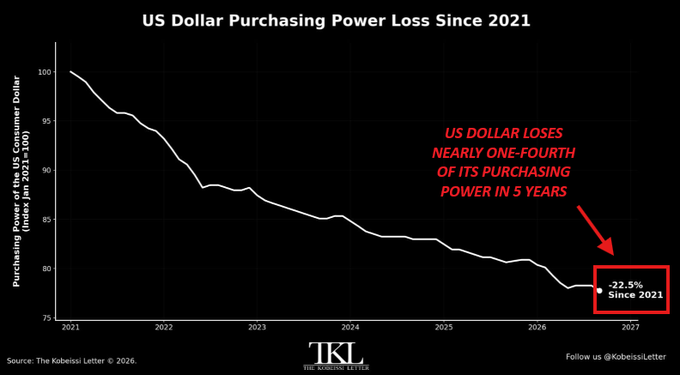
Over this period, the value of the US Dollar has declined by -22.5%. In other words, it now costs $129 to purchase the same goods and services that cost $100 in 2021. Hence, investors want more stocks and hard assets over the long-run, not less.
Therefore, if there were to be any indication of the Iran War ending and the global energy crisis subsiding, this would lead to a domino effect in the bullish direction.
Energy prices would drop, inflation expectations would follow, the Fed could pivot more dovish, the "discount" in technology stocks would be priced-out, and the market's rally would broaden.
All while the AI Revolution continues to accelerate and many large-cap technology stocks become cheaper on a forward earnings basis, even as their stock prices rise.
And in the background, the demand for asset ownership is historically robust.
In Conclusion: The "Bull-Bear Market."
In summary, we believe the S&P 500 is in a bear market, within a bull market.
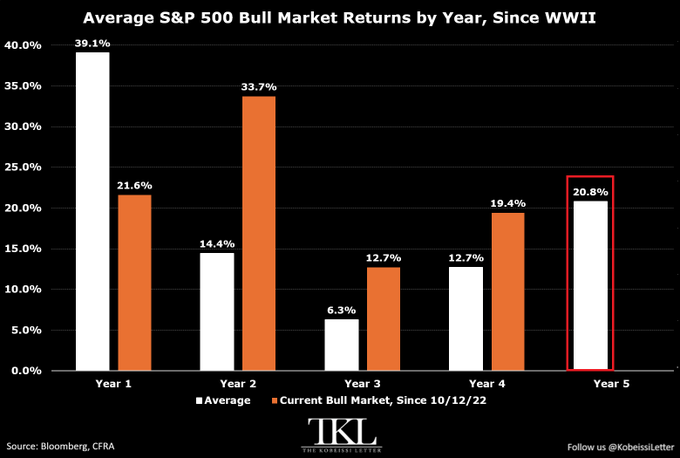
Even as the S&P 500 hits year #5 of its bull market, we believe a steep discount is currently priced into equities. This discount has functioned as a "stealth" bear market, suppressing equity valuations in the world's largest and fastest-growing companies.
This backdrop has the ability to catalyze a violent rally in the S&P 500 if and when it is ultimately priced-out.
We expect a highly eventful 2027.
Follow us @KobeissiLetter for real time analysis as this develops.
More about our strategy: Those who are able to remain objective and follow a process during current times of disruption are realizing some of the best trading conditions ever.
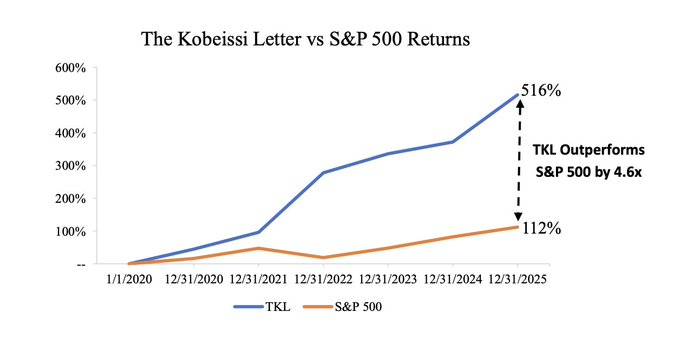
An objective and systematic approach is what has led to our outperformance of market benchmarks.
As shown below, our investment strategy has returned nearly five times the S&P 500 since 2020.
If you are interested in receiving our premium daily analysis, you may do so by joining our service here.